Snapshot of Model Forecasting
May 14, 2020

IHME Model: 134,927 deaths nationwide by June 24, 2020

LANL Model: 117,000 deaths nationwide by June 24, 2020

Imperial College of London: US daily death rate is estimated at 2,000 until May 18, 2020

Columbia University: medium hospital surge in the upcoming 42-days in Baltimore City, MD

COVID-19 Modeling

How do COVID-19 models work, and what do they tell us?

Megan Hunt and Katharine Clark

Models have influenced key policy decisions from the onset of the COVID-19 pandemic.

These models are used to estimate infections rates and mortality rates from COVID-19. Estimates from these different models may vary widely. Part of the reason is that different input values are used in the models, and modelers are making different assumptions.

These include assumptions about the infection fatality rate (% of people infected with COVID-19 who will die), the case fatality rate (% of people who will die of those who tested positive), incubation period of the disease (the length of time it takes for someone who has been exposed to the virus to show symptoms), transmissibility (how likely it is you will be infected through contact with someone who has the disease), and severity of infections.

There are a variety of models being used. Two influential models, the IHME’s model coming out of the University of Washington and the Imperial College of London’s NPIM, have dominated the national conversation. However, the White House’s coronavirus task force has not released a singular model to guide the national response to the pandemic.  There are also notable models from Los Alamos National Laboratory , Northwestern, and Columbia University . At a state level, state leaders are using a “weather forecasting” approach combining several models, often using the IHME’s model, to better predict outcomes.

As more data emerges from the COVID-19 pandemic, especially with regard to virus transmissibility, models are updating in real time to reflect these changes. Social distancing, a key factor impacting infection rates in each state, has become a prominent component of the core assumptions underlying model forecasts. This appreciation for the ability of social distancing guidelines to ‘flatten the curve’ initially led some models, like the IHME, to project decreased total deaths due to COVID-19.

However, in light of loosening restrictions across the majority of the United States, models have revised their forecasts to predict a significant increase in mortality rates as new cases are expected to spread. At the same time that state and federal leadership argue that the pandemic is coming under control, models, incorporating better data, suggest the opposite – making their increasing accuracy that much more important to inform policy decision-making.

Imperial College of London’s NPI model

(as of May 15, 2020)

The Imperial College London model forecasts the number of deaths in the upcoming week by country and analyzes case ascertainment per country.

The NPIM projected 2.2 million US deaths might occur in an “unmitigated” scenario, whereby transmission suppression policies were not instituted to slow or prevent spread of the virus. This initial estimate, published on March 17th, was among the first distributed to the White House, prompting the US government to take drastic actions, such as extensive travel restrictions, to mitigate the spread of the virus.

It is a transmission-based SIR model. Like other SIR models, this model examines individuals/groups of individuals — e.g. school children, household sizes, and workplace distributions — according to population density data and census data, as well as their set of contacts, to simulate transmission rates in a community. This model examines the number of projected US cases and deaths. The model makes forecasts over the next year until April 2021.

The model’s main objective: Forecast the number of deaths in the week ahead for countries with active transmission.

  • Active transmission is defined as having at least 100 deaths reported overall and at least 10 deaths observed in the past 2 weeks.
  • Deaths, instead of cases, are forecasted because the reporting of deaths is presumed to be more reliable and stable over time.
  • The active estimates of transmissibility reflect the epidemiological state of COVID-19 at the time of infection for the deaths the present model is based upon. Therefore, the impact of controls on estimated transmissibility will be quantifiable with a delay between transmission and death.

The secondary objective: to analyze case ascertainment per country.

  • We use the number of reported deaths and of cases reported with a delay (delay from reporting to deaths, see Case Ascertainment method) to analyze the reporting trends per country.
  • If the reporting of cases and deaths were perfect, and the delay between reporting and death is known, the ratio of deaths to delayed cases would equal the Case Fatality Ratio (CFR).

The key assumptions behind the model are:

  • The underlying mean Case Fatality Ratio is 1.38% (95% CI (1.23 – 1.53))
  • The assumed delay from a case being reported to death is a mean of 10 days with a standard deviation of 2 days.
  • It is assumed that all deaths due to COVID-19 have been reported in each country. Even if deaths are not under-reported, constant reporting rate is assumed over time.

The Imperial College London Model uses 3 different models, each of which deploys complex mathematical modeling with differing assumptions about how transmissibility changes throughout the time window of interest.  These 3 models that estimate transmissibility are being averaged to create a final model for each country.

While this model integrates significant levels of population data, its limitations arise from the assumptions the model must make about the transmissibility of the virus. For example, this model is based on the transmissibility of the virus at the contraction of the virus for those who have reportedly died. Thus, there is an inherent lag in the transmissibility data due to the time it takes for death data to be reported.  Furthermore, the true infectivity rate of the virus in symptomatic or asymptomatic is unknown.  Even small miscalculations of the infectivity rate in the model can cause drastic changes in modeling predictions. Infection rates can still represent an estimation, based on testing capabilities in that country, of the virus’s true characteristics.

A previous version of the model (as of March 16, 2020):

A previous version of the model was somewhat different, and included assumptions that are no longer used in the current version.  It examined the number of projected US cases and deaths across a range of various mitigation and suppression scenarios. It made forecasts over the next year until April 2021.

The assumptions in the prior version of the model were:

  • Viral transmission
    • One third of transmission is assumed to occur in the household, one third in schools and workplaces and the remaining third in the community, based on population density and census data concerning households, workplaces, schools and the community.
    • Incubation period was estimated to be 5.1 days.
    • Infectiousness was assumed to occur from 12 hours prior to the onset of symptoms for those that are symptomatic and to 4.6 days after infection in those that are asymptomatic
    • Symptomatic individuals are assumed to be 50% more infectious than asymptomatic individuals.
    • After recovery from infection, individuals are assumed to have short-term immunity to reinfection.
  • Hospitalizations
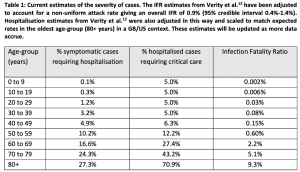
    • In table 1 (from published model), the age-stratified proportion of infections that require hospitalization and the infection fatality ratio (IFR) were obtained from an analysis of a subset of cases from China
    • 30% of those that are hospitalized will require critical care (defined as invasive mechanical ventilation or ECMO)
    • 50% of those in critical care will die and an age-dependent proportion of those that do not require critical care die
    • The bed demand numbers assume a total duration of stay in hospital of 8 days if critical care is not required and 16 days (with 10 days in ICU) if critical care is required.
    • Duration of hospitalization of 10.4 days

The Imperial College London previously integrated different Non-Pharmaceutical Interventions (NPI) into their modeling to determine the best policy strategy to control COVID-19. These NPI are no longer included in the model. Rather, the model relies on current data and transmissibility estimates.

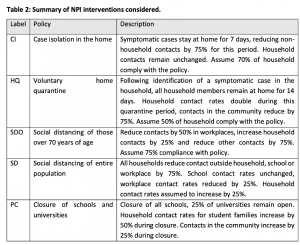
The previous version of the model included these Non-Pharmaceutical Interventions (descriptions in Table 2, from published model):

  • Case isolation and voluntary home quarantine are triggered by the onset of symptoms and are implemented the next day.
  • Social distancing of those over 70 years, social distancing of the entire population, stopping mass gatherings and closure of schools and universities are decisions made at the government level. In the case of lightened social distancing measures, surveillance triggers, or defined case thresholds that will indicate the need for re-implementation of social distancing, should be based on testing of patients in critical care (intensive care units, ICUs).
  • Policies are assumed to be in force for 3 months, other than social distancing of those over the age of 70 which is assumed to remain in place for one month longer. Suppression strategies are assumed to be in place for 5 months or longer.

Relative to each NPI intervention, the model uses the described assumptions to provide the following output predictions:

  1. Total deaths
  2. Peak ICU beds
  3. Proportion of time with social distancing in place
University of Washington’s IHME model

(as of May 15, 2020)

The IHME’s model, from the University of Washington, is a curve-fitting/extrapolation model based on statistical mortality growth curves of the disease, not based upon the underlying epidemiology of the disease. The model relies on reported statistics of the disease, such as worldwide COVID-19 deaths, and then extrapolates similar patterns in emerging death data from the US and other countries to forecast anticipated deaths from the virus. Initially the model used trending curves of death from China but has since updated that information to include COVID-19 mortality curves from Italy and New York, for instance.

The IHME model has been greatly enhanced since its inception. Most notably, the model is integrating social distancing policy data by country into the model. The model projects infections and testing that is occurring to better inform public health officials who will be making the decision as to when to ease social distancing.

Mobility is one of the main indicators of social distancing in this model. Defined as personal movement by a population, mobility is based on anonymous cellphone data made available by technology companies. There is a direct correlation with high mobility and high risk of spreading COVID-19.

The model indicates that, after the inclusion of social distancing modeling, there has been a marked increase in death estimates. This is attributed to the states that have begun easing social distancing without curbing the COVID-19 pandemic in their area or increasing testing capacity to match the rate of infections.

The IHME model is reporting data for all countries, except Ecuador, via the aforementioned model which integrates social distancing metrics (aka mobility), COVID-19 deaths, cases, and testing. Interestingly, in Ecuador, the case rate is statistically too low to be accurate. To accommodate for insufficient data, the model has used trends in mortality to extrapolate the contribution of COVID-19 to excess deaths seen in 14 European countries. This data indicates that 55.3% of excess deaths are due to COVID-19. Thus, the model is assuming this proportion of Ecuador’s excess deaths to be due to COVID-19.

The key input assumptions behind the IHME’s model are:

  • Data on confirmed COVID-19 deaths by day
    • Sources include World Health Organization websites, JHU GitHub, local and national governments
    • Specific data for NYC from NY Times GitHub repository
  • Data on hospital capacity and utilization for U.S. states
    • Data from the AHA, other publicly available sources, and governments
    • Extrapolated from observed COVID-19 utilization data from select locations (e.g., Italy, China, Korea, and the U.S).
    • Established capacity by state and for the U.S. is based on numbers for the next 4 months (August 2020)
  • Social distancing adherence based on mobility data
    • Data from mobile phones is used to augment social distancing data
    • Trends based on data from Germany, Italy, China, Spain and parts of the US

The model uses these assumptions and previous trends to forecast:

  1. peak death and resource usage dates
  2. peak daily deaths and hospital utilization (e.g., beds, ICU beds, ventilators)

Using this model’s early data on the effects of early social distancing guidelines given in March, the White House released estimates that between 100,000 and 240,000 Americans, instead of millions, may die from coronavirus – after the implementation of social distancing, these estimates had been revised downwards under the IHME’s model. However, with states reopening nationwide, it is expected for these estimates to increase again.

The main criticism of this model at its conception was that it assumed the effects of social distancing are equivalent across different countries. The model was based upon viral spreading curves from countries like China, where the stringency of social distancing laws was dramatically different than the US, for example. Furthermore, the model assumed these restrictions were not only consistently implemented in each region but also that they would remain effective throughout the regions of interest for the entire duration. These assumptions are no longer required with the introduction of social distancing data from mobile devices.

Columbia University SIR Model: Severe COVID-19 Risk Mapping

(as of May 15, 2020)

This model, like the Imperial College London, is a metropolitan SIR or SEIR model. Fundamentally, its assumptions are based on social distancing measures and how they will change in the future. Complex mathematical equations estimate day-time and night-time transmissibility. Movement of people within counties is estimated by SafeGraph, a tool that forecasts the reduction of inter-county visitor numbers in points of interest, such as restaurants and stores. Delay in reporting of cases is also estimated within their mathematical calculations, similarly to the Imperial College London model.

The assumptions of the Columbia model include:

  • A 20% reduction in contact rates for each week that stay-at-home orders remain in place or are expected to remain in place.
  • After a state is re-opened, contact rates are assumed to increase by 5% each week.

The model reports a variety of outcomes including:

  • Projected severe COVID-19 cases by US-county.
  • Supply estimates of hospital critical care beds.
  • Via interactive map, the viewer can see the impact of various scenarios of hospital response to patient surges and changes in social contact.
  • Expected time to patient demand exceeding hospital capacity for a 42-day horizon from May 11th, 2020.
  • High risk patients for severe COVID-19 by county:
    • Number of people age 65+
    • People with underlying health conditions vulnerable to severe COVID-19
Los Alamos National Laboratory Model

(as of May 15, 2020)

The Los Alamos National Laboratory (LANL) Model, developed by the Los Alamos National Laboratory, a top-tier government research laboratory, is a statistical growth model. This model is different from those previously discussed as it does not make assumptions about how the virus is spreading. Instead, it forecasts the rate at which the virus will continue to spread. Inherently, this paradigm then allows for fewer assumptions to be made than other COVID-19 models. Consequently, this model is less susceptible to mistakes due to core assumptions. These statistical growth models are sensitive to changes in virus conditions, and such changes may be caused by forces independent of the virus.

The model forecasts future confirmed cases and deaths based off of data from the JHU Coronavirus Resource Center Dashboard. These forecasts, provided on a state-by-state basis in the United States, is accompanied by estimates of the peak surge in each state.

Levels of uncertainty in this model originate from:

  • Potential for the virus growth parameter to change in the future
  • Measurement uncertainty of the number of reported cases and deaths.